Mapping Recovery Timelines: How Back-to-Back Schedules Shift Performance Benchmarks in Soccer, Tennis, and Equine Events
Elena Hoffmann · Aug 22, 2026
Mapping Recovery Timelines: How Back-to-Back Schedules Shift Performance Benchmarks in Soccer, Tennis, and Equine Events
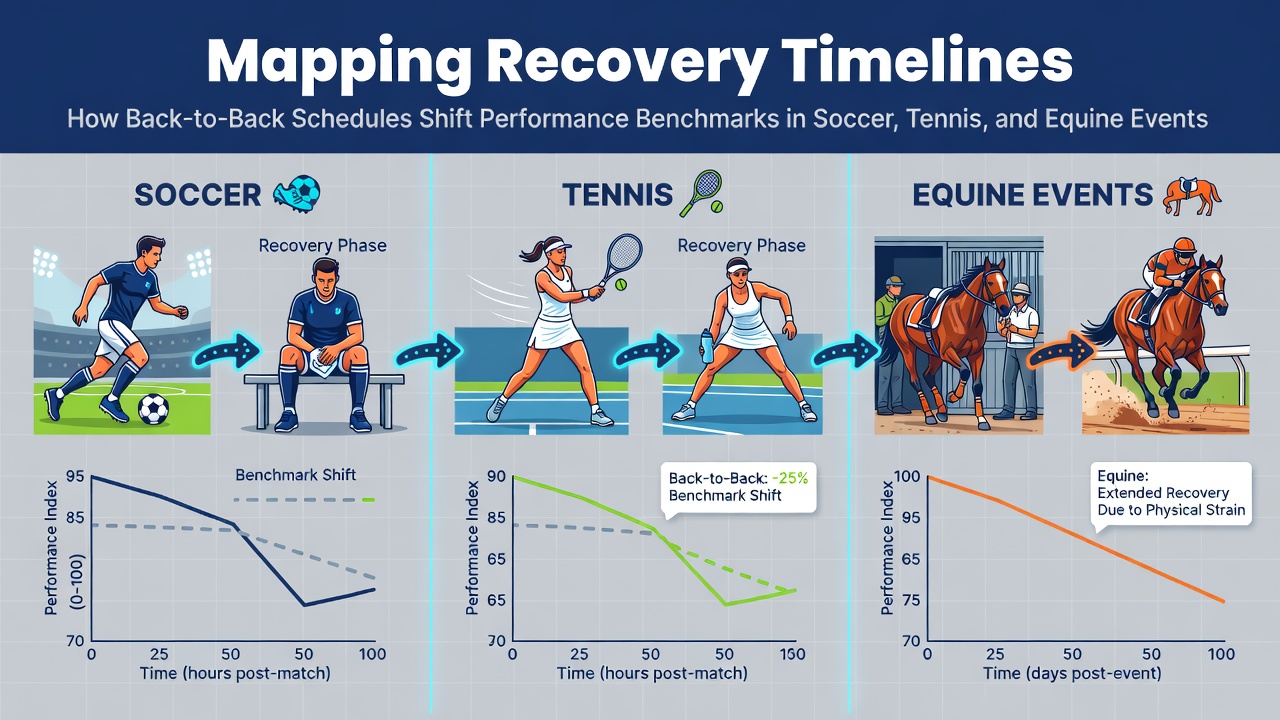
Back-to-back schedules have become a defining feature across soccer, tennis, and equine events, and the resulting compression of recovery periods produces measurable shifts in performance benchmarks that researchers track through standardized metrics like sprint distance covered, serve accuracy retention, and finishing times in races. Data from multiple seasons shows that athletes and equine athletes alike experience declines in key output areas when rest intervals fall below established thresholds, while organizations continue to monitor these patterns through league-wide tracking systems.
Soccer Fixture Congestion and Player Output
Professional soccer calendars pack domestic leagues, cup competitions, and international windows into overlapping blocks, and this structure forces many players into sequences with fewer than seventy-two hours between matches. Studies from European leagues indicate that high-intensity running drops by measurable percentages in the second and third games of such clusters, while injury incidence rises according to data compiled by medical panels affiliated with governing bodies. Observers note that central midfielders and fullbacks register the steepest reductions because their positional demands combine repeated accelerations with defensive recovery runs, and these patterns appear consistently across tracked seasons.
Recovery protocols now incorporate GPS-derived workload monitoring alongside blood biomarker panels, and clubs adjust training loads accordingly when schedules tighten. Figures released by the Union of European Football Associations reveal that teams advancing deep into multiple competitions post lower average possession retention in later rounds, and the trend holds across several monitored campaigns. August 2026 calendars already show clusters where top sides play three matches inside eight days, creating conditions that mirror the documented performance dips observed in prior years.
Tennis Tournament Structures and Match Density
Tennis circuits schedule main-draw events on consecutive weeks with qualifying rounds inserted before many tournaments, and players who progress far in one week often face abbreviated preparation for the next. Grand Slam draws extend over two weeks while smaller events compress into five or six days, and travel between continents adds further physiological stress. Performance data collected at ATP and WTA events indicate that first-serve percentages decline after three matches within five days, while unforced error rates climb when rest between rounds drops under twenty-four hours.
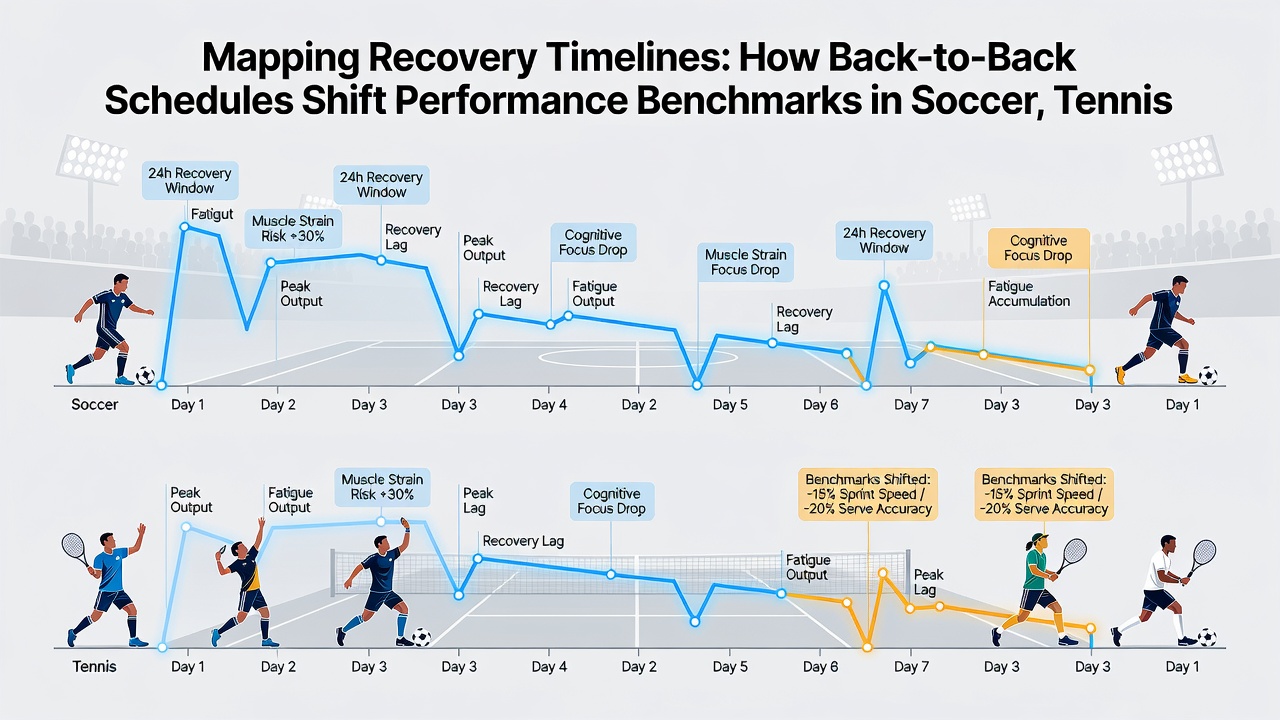
Researchers at institutions including the Australian Institute of Sport have published findings linking cumulative match load to reductions in movement efficiency, and these studies track variables such as court coverage speed and rally length sustainability. Tournament directors adjust start times and rest days where possible, yet the underlying calendar density remains a constant pressure point for both singles and doubles competitors.
Equine Event Scheduling and Physiological Recovery
Equine competitions in flat racing, jump racing, and eventing place horses on schedules that range from weekly starts at regional meetings to multi-day festivals at major tracks. Veterinary records compiled by bodies such as the Canadian Pari-Mutuel Agency show that muscle enzyme levels remain elevated for several days after intense efforts, and horses entered again before full normalization post slower sectional times in subsequent outings. Trainers monitor heart-rate recovery curves and stride-length consistency, and data sets from multiple jurisdictions confirm that back-to-back runs inside ten days correlate with measurable drops in peak velocity maintenance.
August 2026 race programs include several high-profile meetings spaced only days apart, and regulatory guidelines now require minimum intervals between certain classes of events to safeguard welfare standards. These intervals align with observed recovery curves that veterinary researchers have mapped through repeated blood sampling and gait analysis.
Cross-Sport Patterns in Benchmark Shifts
Comparative reviews of performance datasets reveal shared thresholds where recovery shortfalls begin to register across the three disciplines. Soccer players show reduced high-speed distance after repeated short-turnaround fixtures, tennis competitors exhibit serve-speed decrements following dense tournament blocks, and equine athletes display extended recovery times between races when entered without adequate intervals. Academic papers housed in repositories such as PubMed Central document these parallel trends through longitudinal studies that standardize variables like workload accumulation and subsequent output metrics.
Coaches and equine specialists apply periodized training blocks to offset cumulative fatigue, yet the external calendar constraints limit full mitigation. Organizations continue to refine rest recommendations based on accumulating evidence rather than fixed assumptions about individual resilience.
Conclusion
Recovery timelines in soccer, tennis, and equine events follow predictable trajectories once back-to-back demands exceed established rest windows, and the resulting benchmark shifts appear consistently in aggregated performance data. Continued monitoring through wearable technology, veterinary assessments, and league-wide statistics provides the factual basis for understanding these dynamics without reliance on subjective interpretation.