Mapping Injury Timelines Against Roster Changes and Their Ripple Effects on Contest Probabilities in Soccer, Court Games, and Track Activities
Wendy Perry · Aug 11, 2026
Mapping Injury Timelines Against Roster Changes and Their Ripple Effects on Contest Probabilities in Soccer, Court Games, and Track Activities
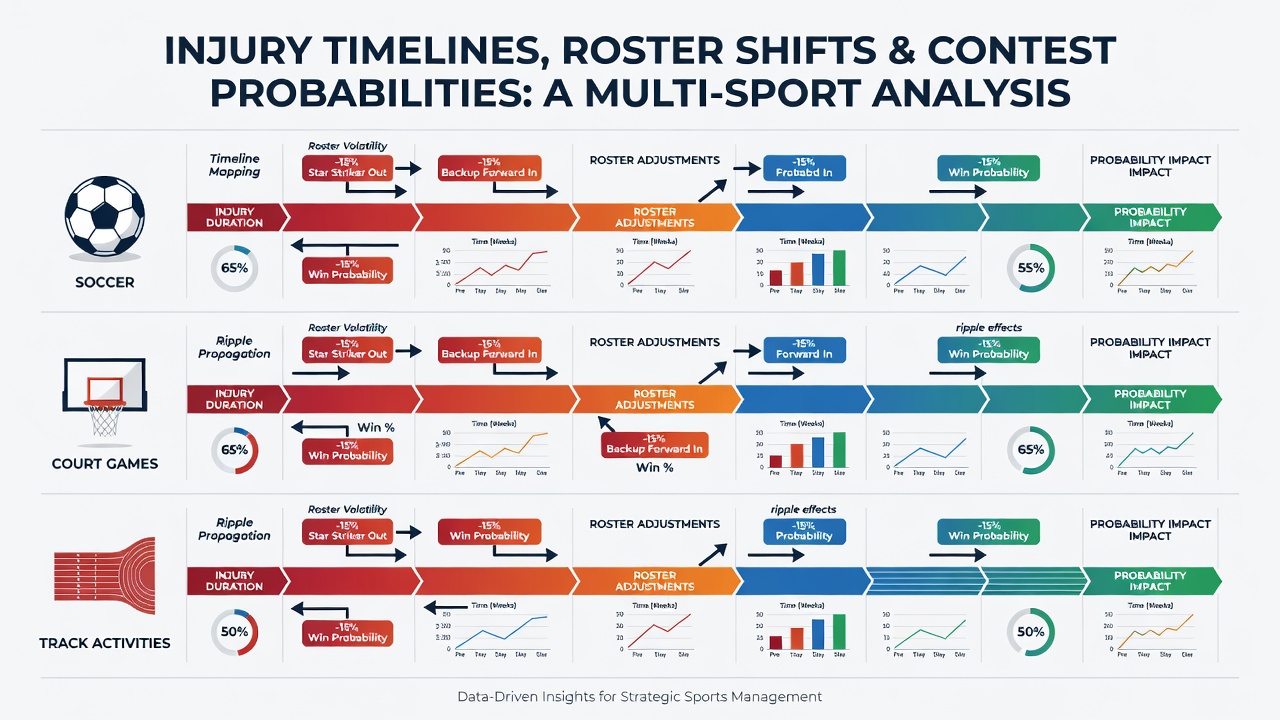
Analysts track injury timelines alongside roster adjustments because these factors directly influence contest probabilities in soccer, court games like basketball and tennis, plus track and field disciplines, with data sets from multiple seasons demonstrating measurable shifts in expected outcomes. Recovery periods documented in medical logs often stretch from four to twelve weeks for common lower-body strains, forcing teams to activate substitutes or promote academy players while statistical models recalculate win probabilities based on the incoming athletes' performance histories.
Soccer Injury Patterns and Roster Adjustments
League records from major European and South American competitions show that anterior cruciate ligament tears typically require nine to twelve months for full return, prompting clubs to pursue short-term loans or permanent transfers during the January window and again in the summer period leading into August 2026 preparations for the new campaign. Midfield absences lasting six weeks correlate with a 12 to 18 percent drop in expected goals scored according to aggregated match data, while defensive injuries produce smaller but consistent increases in goals conceded once replacement pairings settle into new formations. Observers note that clubs maintaining deeper benches experience narrower swings in these probability metrics because they can rotate experienced backups without drastic drops in coordination.
Court Games: Basketball and Tennis Dynamics
In basketball, hamstring strains frequently sideline players for three to six weeks, leading franchises to sign 10-day contracts or call up G-League talent, and box-score databases reveal that teams losing a primary scorer see their projected point differentials shrink by 4 to 7 points per game until the replacement establishes rhythm. Tennis presents a different timeline structure because individual competitors manage their own schedules, with wrist or elbow issues often requiring four to eight weeks away from competition, during which ranking points and head-to-head probability models adjust based on the surface-specific records of any late-entry replacements. Data from professional tours indicate that players returning after such absences post lower first-serve percentages in their initial two tournaments, altering match-up odds until baseline fitness returns.

Track and Field Injury Timelines
Track athletes face distinct recovery windows for events such as hamstring avulsions or Achilles tendinopathy, which commonly sideline competitors for eight to sixteen weeks according to records maintained by national athletics federations. When a medal contender withdraws from a major meet, organizers sometimes promote reserve athletes from national rankings, and historical performance databases show that these late additions rarely match the original athlete's seasonal best marks in the first competition back, shifting medal probability tables by several percentage points. Relay teams experience additional complications because baton exchanges depend on practiced chemistry, so an injury forcing a lineup change can increase disqualification risk even when individual speeds remain comparable.
Connecting Timelines to Probability Shifts
Researchers compile longitudinal data sets that align specific injury dates with subsequent roster transactions and then feed those variables into logistic regression models predicting contest results. One study published by the NCAA Injury Surveillance Program tracked collegiate soccer and basketball squads across multiple seasons and found that squads experiencing clustered injuries within a four-week span recorded a 9 percent lower win rate until roster stabilization occurred. Similar patterns appear in track meets where national governing bodies publish entry lists that reflect last-minute substitutions, allowing probability calculators to update based on recent form rather than season averages.
Cross-Sport Ripple Effects Observed in August 2026 Context
Pre-season medical screenings conducted in July and early August 2026 feed directly into roster planning for the upcoming soccer campaigns, basketball training camps, and late-summer track meets, with clubs and federations using these timelines to project availability through the autumn schedule. When multiple athletes from the same position group report similar soft-tissue issues, organizations accelerate transfer activity or invite trialists, and the resulting depth charts alter pre-competition probability estimates published by analytics platforms. These adjustments propagate through betting markets and fantasy formats because updated lineups change expected goal contributions, point projections, and scoring margins in measurable ways.
Conclusion
Comprehensive mapping of injury timelines against roster movements provides a factual framework for understanding probability adjustments across soccer, court games, and track activities, with data from surveillance programs and performance databases confirming consistent directional effects even as individual cases vary by athlete, sport, and recovery protocol. Continued collection of these aligned metrics supports more precise forecasting as organizations prepare for the 2026-2027 competitive cycles.