Fixture Fatigue Factors: Mapping Congested Calendars Against Outcomes in League Football, Racing Circuits, Tennis Tours, and Golf Events
Elena Hoffmann · Jul 21, 2026
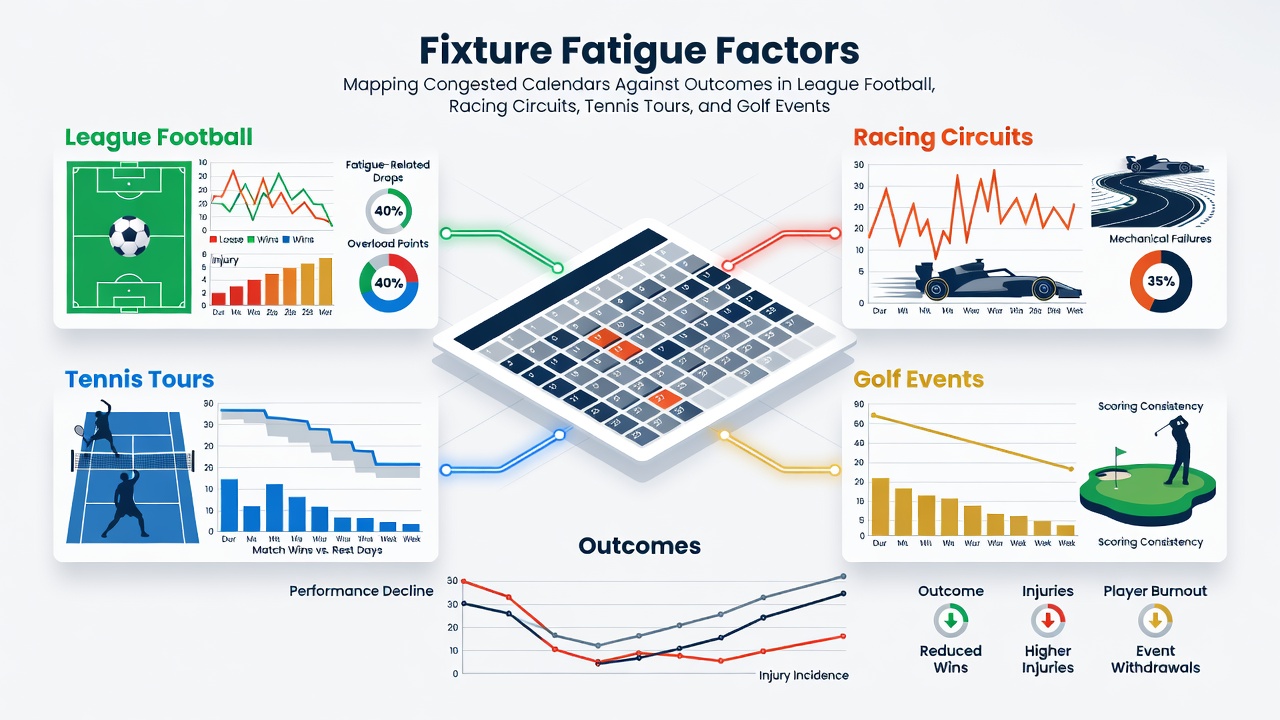
Fixture Fatigue Factors: Mapping Congested Calendars Against Outcomes in League Football, Racing Circuits, Tennis Tours, and Golf Events
Fixture congestion creates measurable effects on performance across multiple sports, and researchers have tracked these patterns through detailed calendar mapping and outcome data. League football schedules often pack multiple matches into short windows while racing circuits, tennis tours and golf events add their own layers of travel and recovery demands, and analysts compare these variables against win rates, lap times, match durations and scoring averages to identify consistent trends.
League Football Patterns
European domestic leagues and continental competitions frequently overlap during winter and spring months, producing clusters of three or four fixtures inside fourteen days for top clubs. Data compiled by national federations shows elevated injury incidence rates during these periods, particularly in muscle strains among midfield players who log the highest minutes. Teams that rotate squads more systematically record fewer late-match concessions compared with sides that rely on the same starting eleven across consecutive games, according to performance reports issued by several European leagues.
Racing Circuits and Recovery Windows
Thoroughbred racing calendars in major jurisdictions schedule meetings on consecutive days at different tracks, forcing horses and jockeys into repeated travel. Studies of Australian and North American circuits indicate that runners with less than seven days between starts post lower win percentages than those granted longer gaps, especially on turf surfaces that demand greater recovery from soft-ground efforts. Handlers who adjust training loads around these compressed schedules maintain steadier form figures, and track officials have noted corresponding shifts in average field speeds when multiple cards run back-to-back.
Tennis Tours and Travel Load
The ATP and WTA calendars extend through summer hard-court swings that place players in successive cities with minimal rest. Tournament databases reveal that competitors who contest both a 500-level event and a subsequent 250-level tournament within ten days experience measurable drops in first-serve percentages and rally endurance, while those who skip optional events preserve higher win rates in later rounds. Medical staff at several Grand Slam venues have documented increased treatment requests during July weeks when the calendar compresses further around major championships.
Golf Events and Multi-Week Blocks
Professional golf circuits schedule consecutive tournaments across different continents during the northern-hemisphere summer, and stroke-play data from the PGA Tour and DP World Tour illustrate how cumulative walking distance and practice volume affect scoring in final rounds. Players who complete three events inside twenty-one days post higher average scores on approach shots compared with those who insert a rest week, and statistical models produced by tour analytics departments link these patterns to finish-position variance rather than outright wins.
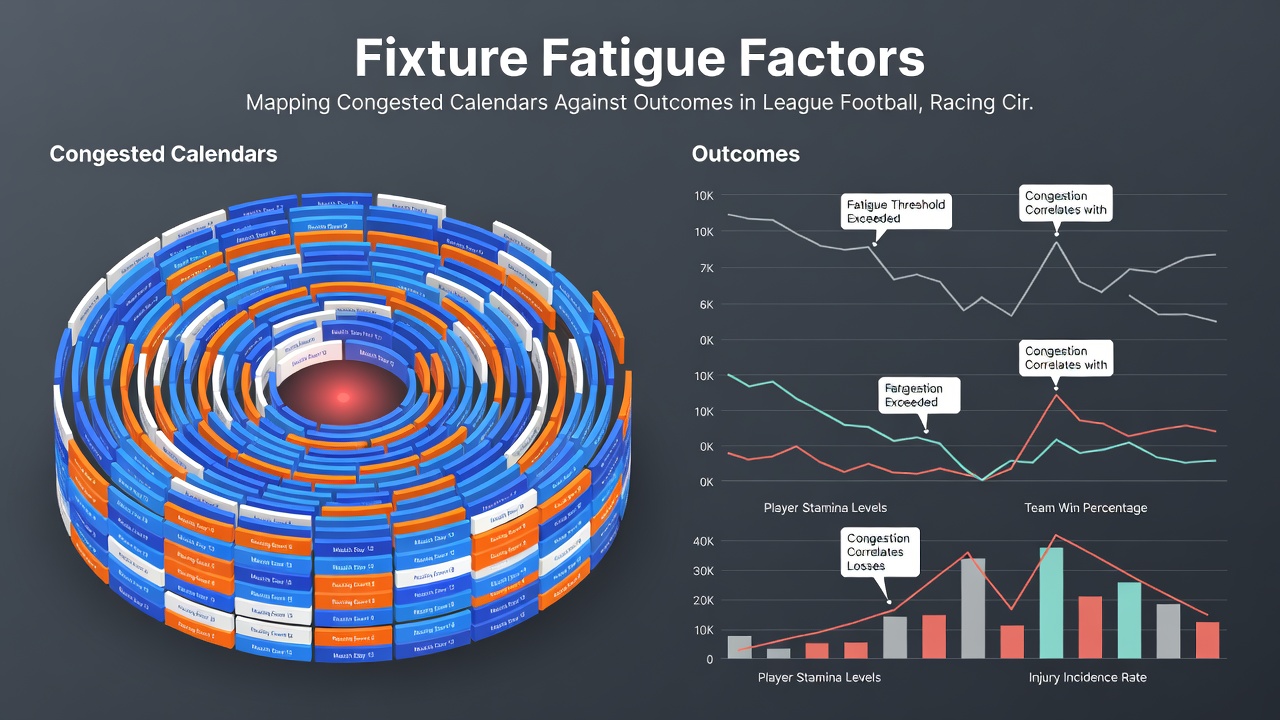
July 2026 brings an especially dense stretch that places the British Open, several ATP and WTA 500 events, Royal Ascot and multiple Premier League pre-season tours within the same four-week window. Organisers have already published provisional calendars that flag potential overlaps for athletes who compete across more than one discipline, and governing bodies continue to monitor recovery metrics collected from wearable devices.
Cross-Sport Data Comparisons
Academic researchers at institutions including the University of Queensland have examined combined datasets that align fixture density with performance indicators across the four sports. Their models show that a 20 percent increase in scheduled activities within a thirty-day window correlates with a 4 to 7 percent decline in key output measures such as goals scored, strike rate, games won and greens in regulation. These findings appear in peer-reviewed papers that control for travel distance, surface type and opponent strength.
Industry groups such as the International Council of Sport Science and Physical Education have released position statements urging federations to publish recovery guidelines before finalising annual calendars. Several national associations now require clubs and tours to report aggregate player-load figures at the end of each season, creating larger datasets for future mapping exercises.
Conclusion
Calendar analysis across league football, racing circuits, tennis tours and golf events demonstrates repeatable relationships between fixture density and measurable performance outcomes. Organisations continue to refine scheduling tools that incorporate injury surveillance, travel logs and recovery markers, while ongoing data collection supports more precise adjustments to future seasons.