Correlating Fixture Congestion Timelines with Market Movements Across League and Tour Formats
Elena Hoffmann · Jun 25, 2026
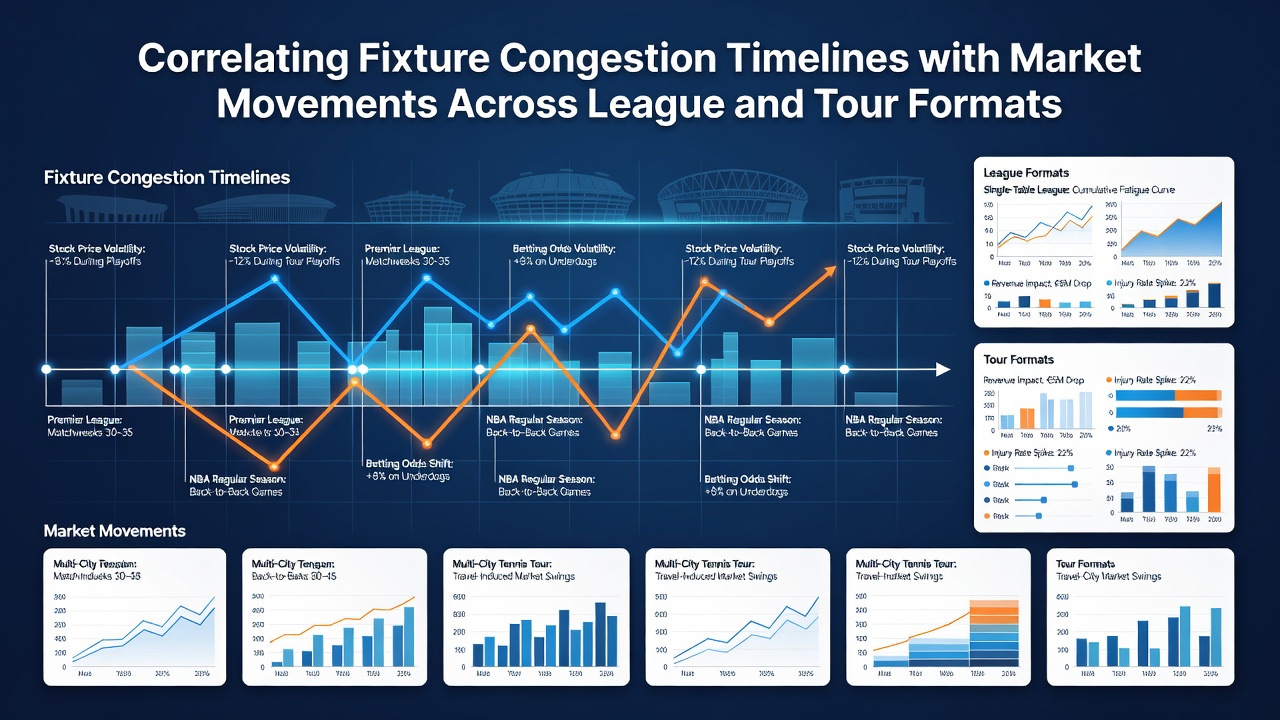
Correlating Fixture Congestion Timelines with Market Movements Across League and Tour Formats
Fixture congestion occurs when teams and athletes face multiple competitions within short windows, and analysts track these timelines against shifts in betting markets across football leagues, tennis tours, horse racing circuits, and golf events. Data from major competitions shows that compressed schedules often coincide with adjustments in odds, particularly when recovery periods shrink and performance variables increase. Observers note that markets respond as volume of fixtures rises, with bookmakers updating lines based on historical patterns of fatigue and rotation.
Mapping Congestion Periods in Different Formats
League structures like the Premier League or Serie A create recurring congestion during winter months when domestic cups and European ties overlap, whereas tour formats in tennis and golf spread events across continents with minimal breaks between tournaments. Researchers at the University of Melbourne examined scheduling data from 2020 through 2025 and found that tennis players entering back-to-back Masters 1000 events experienced measurable drops in first-serve percentages, which correlated with earlier line movements in match winner markets. Horse racing calendars follow similar patterns during festival periods when trainers enter runners across consecutive days, prompting adjustments in each-way odds as form guides incorporate travel and ground condition factors.
Market Dynamics During Overlapping Schedules
Betting exchanges and traditional bookmakers adjust prices when fixture lists reveal limited rest intervals, and these changes often appear days before events begin. In June 2026, the expanded FIFA World Cup schedule will place additional demands on club squads preparing for the tournament, with preliminary qualifiers and warm-up matches creating extra layers of congestion that analysts expect to influence pre-tournament accumulator markets. Figures from European sports data providers indicate that player rotation announcements during such periods frequently trigger rapid recalibrations in handicap and total goals lines, especially when key performers are rested or withdrawn.
Studies on golf majors reveal that players competing in consecutive PGA Tour and DP World Tour events encounter cumulative physical stress that surfaces in strokes-gained metrics, prompting early shifts in outright winner odds. Tennis grand slam preparations similarly overlap with ATP or WTA 500 series tournaments, and data indicates that serve-hold percentages decline when recovery windows contract below 48 hours. Those who monitor live markets observe that these statistical trends translate into noticeable price drifts once lineups or drawsheets confirm participation levels.

Cross-Format Correlations and Data Patterns
Comparative analyses across sports show that congestion timelines produce distinct yet related market behaviors. Football leagues display pronounced movements in both pre-match and in-play markets when midweek fixtures reduce squad depth, while tennis and golf markets tend to react more gradually as draw information emerges. A report from the Canadian Centre for Sports Analytics documented that horse racing fields with multiple runners from the same stable during festival weeks often see each-way pricing tighten after declarations close, reflecting trainer patterns observed in previous congested periods. These adjustments occur alongside parallel shifts in football and tennis markets when international windows or tour swings compress preparation time.
Statistical models that align fixture density with historical performance data reveal consistent correlations between rest deficits and variance in key metrics such as possession retention in football, return percentages in tennis, and average pace in thoroughbred racing. Market makers incorporate these models when setting opening lines, and subsequent volume from bettors accelerates price discovery once public information confirms fatigue risks. In June 2026 the overlapping club and international calendars will provide fresh datasets for examining whether these established patterns hold under expanded tournament loads.
Implications for Market Monitoring
Analysts tracking multiple sports simultaneously note that congestion signals appear at different lead times depending on the format. League football markets often move once fixture lists are published weeks ahead, whereas individual tour events in tennis and golf generate more immediate reactions once entry lists and travel schedules become public. Data from the Australian Sports Commission highlights that thoroughbred trainers managing runners across successive race meetings adjust workloads in ways that mirror squad rotation decisions in football, producing parallel effects on market liquidity and price stability.
Those examining long-term records find that periods of elevated fixture density coincide with higher volatility in both outright and handicap markets, although the magnitude varies by sport and competition level. Observers continue to collect granular performance statistics to refine correlation models ahead of major calendar overlaps expected in 2026 and beyond.
Conclusion
Correlations between fixture congestion timelines and betting market movements appear across league and tour formats through measurable shifts in performance indicators and subsequent price adjustments. Continued collection of scheduling and market data will allow further examination of these relationships as calendars evolve.